

Infographic examples: 20 by type, and why each one works
Infographic examples sorted by type: statistics, surveys, comparisons, timelines, budgets, processes, maps and tips, with what makes each one work.
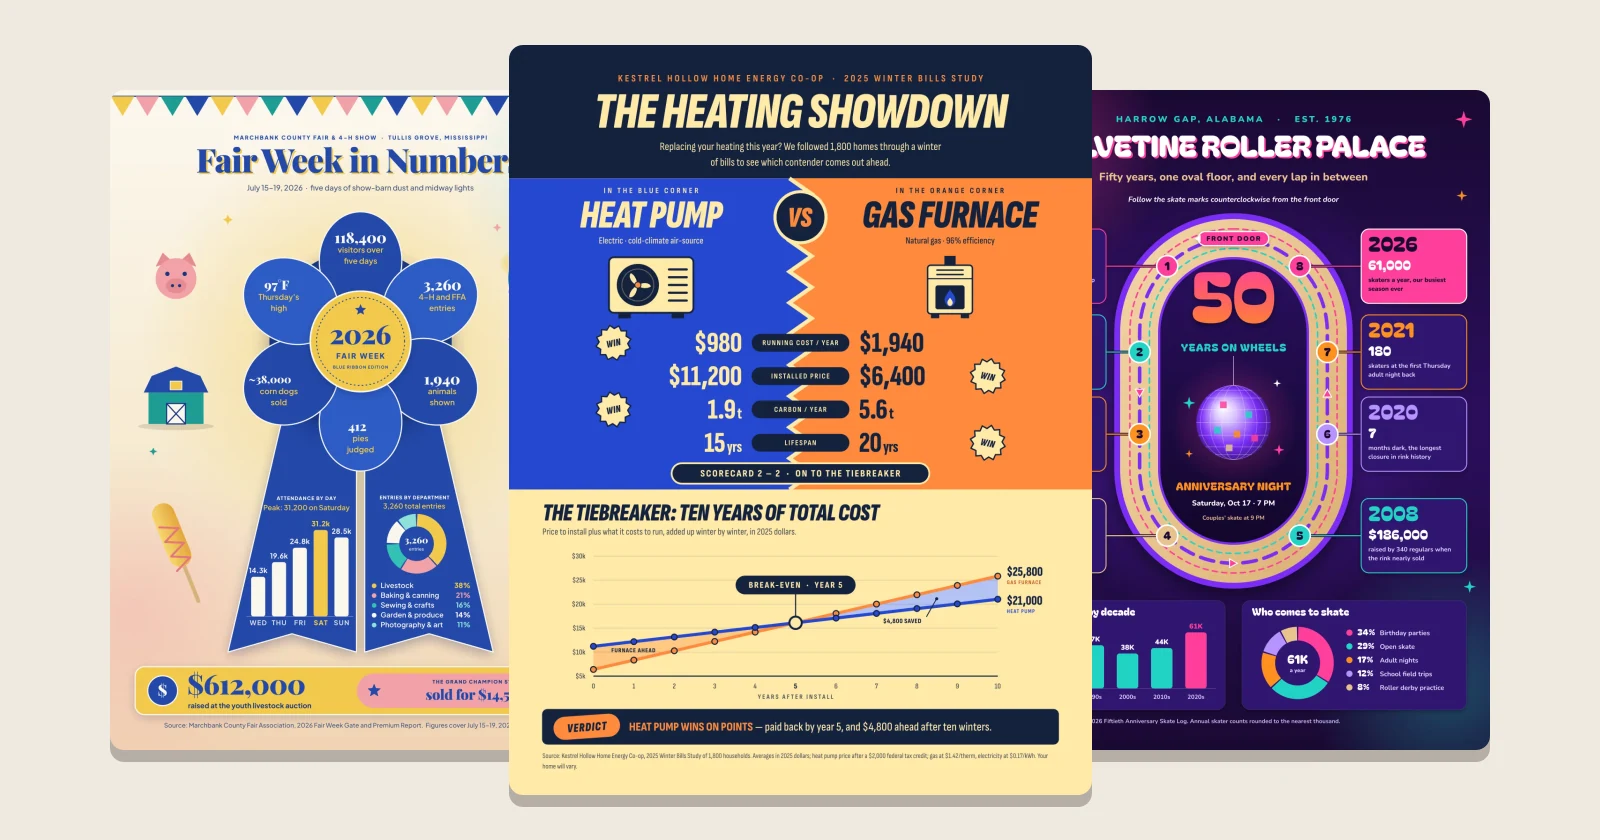
An infographic is one image that explains a subject with numbers, charts, icons and a few short lines of text, laid out so it reads in a minute. The type you pick depends on the data you have: big numbers for a statistics infographic, bars for survey results, two columns for a comparison, a line of dates for a timeline, numbered stops for a process. Below are 20 infographic examples sorted by those types, with what makes each one work.
Every example is a template from the boom.design infographic templates. The places, people and figures in them are made up, so replace them with your own: open one, type in your numbers, and download it for a post, a newsletter or the wall. The steps are near the end.
What is an infographic?
The word joins "information" and "graphics". The idea is much older than the word: William Playfair is credited with the line and bar charts, in his Commercial and Political Atlas of 1786. Florence Nightingale's 1858 diagram set the British army's deaths in the Crimean War in twelve monthly wedges, colored by cause, and Charles Joseph Minard's 1869 map of Napoleon's march on Moscow drew the shrinking army as a band that narrows as men are lost.
What they share is what a good infographic still does today: it picks one story in the data and draws it, so the reader sees the point before reading a word.
Pick the type from the data you have
Lists of infographic types rarely say which one to use. Start from the data in front of you:
| What you have | Type | What to draw |
|---|---|---|
| A handful of striking numbers | Statistics | Each number set big, with one line under it |
| Answers from many people | Survey results | Bars of percentages, longest first |
| Two options to choose between | Comparison | Two columns, the same rows in each |
| Events or growth over the years | Timeline | Dates in order along one path |
| Where money comes from or goes | Budget | One whole split into parts: a donut or a grid |
| Steps that happen in order | Process | Numbered stops joined by a line or arrows |
| Places and the distances between them | Map or travel guide | A simple route, not a real map |
| Advice or things to do | Tips and checklists | A short numbered list with an icon each |
Most of the examples below mix two types: a timeline with a bar chart under it, a process with a donut chart at the foot. That's fine, as long as one type leads and the rest support it.
Statistics infographics
1. One ribbon, six numbers
A race day told as numbers that hang off a medal ribbon, one every few inches: finishers, the temperature at the start, the winning time, paper cups, volunteers, the oldest finisher. The ribbon gives the eye one path to follow, and each number gets a single line of context ("nearly 8 for every finisher") so it means something. A bar chart of finish times sits at the foot, for readers who want more.

2. Numbers on the thing itself
A county fair's week in numbers sits on a blue-ribbon rosette: six petals for six figures, and the ribbon's two tails hold a bar chart of attendance by day and a donut of entries by department. Drawing the numbers on an object from the subject makes the theme clear before anyone reads the headline.

3. Tags, then the trend
An animal shelter's year opens with four numbers on pet tags, then one bar split by kind of animal, then a line chart of adoptions month by month with July's peak marked. It moves from the headline figures to the detail, and uses a line chart only where the numbers change over time.

Survey results infographics
4. Big percentages first
A birdwatching club's winter feeder survey puts its most surprising answers in big type (87% keep feeders full all winter, 1 in 3 saw a hawk), then lists the most-reported birds as bars from most to fewest. The feeder drawn down the left side holds the sections together.

5. A face for each question
A bus rider survey seats six riders in the windows of a bus, each holding the answer to one question: how often they ride, whether there's a car at home, how long they wait in summer. A drawn person makes a percentage feel like people. Below the bus, one bar chart answers why riders ride, and a box gives the date of the vote the survey is for.

6. A chart shaped like the question
When a survey asks about time, draw a clock. A sleep survey of remote workers sets bedtimes around a clock face, the bars growing out of each hour, with the peak hour in a second color and the median bedtime in the middle. Four figures sit in the corners, so the clock stays the center of attention.

More: survey results infographic templates.
Comparison infographics
7. A scorecard with a verdict
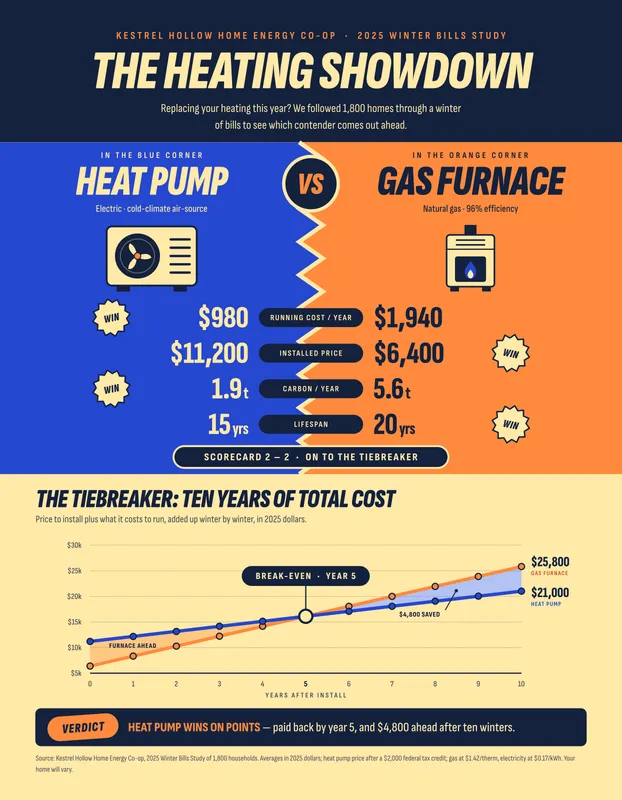
A heat pump against a gas furnace, set up as a boxing match: blue corner, orange corner, four rows of figures with "WIN" beside the better one. The score comes out 2 to 2, so a line chart of ten years of total cost settles it, with the break-even year marked. A comparison that ends with a verdict answers the question the reader came with.
8. The same rows on both sides
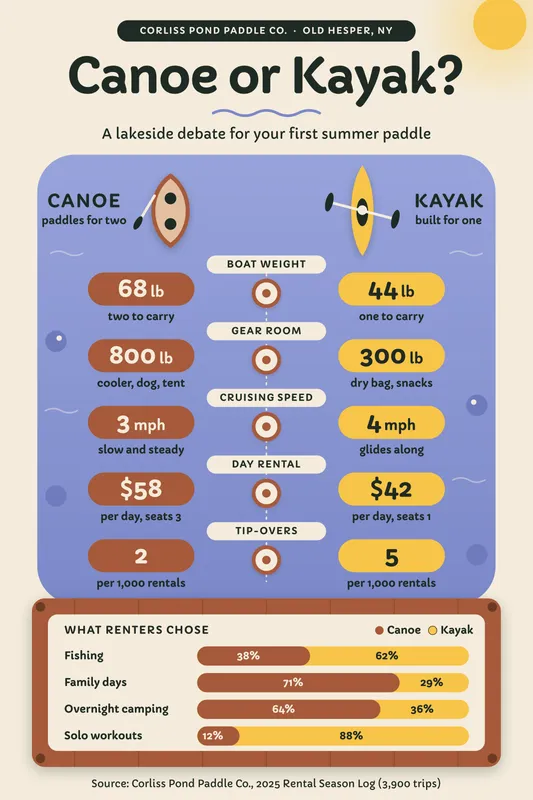
Canoe or kayak puts the two boats at the top and the same five rows under each (weight, gear room, speed, day rental, tip-overs), with the label in the middle. Matching rows let the eye jump straight across. A stacked bar at the foot shows which one renters chose for each kind of trip.
More: comparison infographic templates.
Timeline infographics
9. A path that loops back
A roller rink's 50 years run counterclockwise round an oval skating floor, from the front door in 1976 to this year, eight dates in all. The path tells the reader where to start and which way to go, and the anniversary night sits in the middle of the loop. Two small charts under it, skaters by decade and who comes to skate, add the numbers.

10. One block a year
A quilt shop's twelve years are twelve quilt blocks, each a little fancier than the year before, with that year's sales, bolts of fabric and staff beside it. The growth shows in the pictures before you read a figure. This long, narrow format suits a blog post more than a printed page.

More: timeline infographic templates.
Budget infographics
11. A waffle chart of 100 seats
A school musical's $28,500 budget is a theater of 100 seats, each seat 1% of the budget, colored by what the money paid for. A waffle chart like this is easier to read than a pie chart with seven slices: you can count the squares. Two ticket prices and a bar chart of the four shows complete it.

12. A donut with its total in the middle
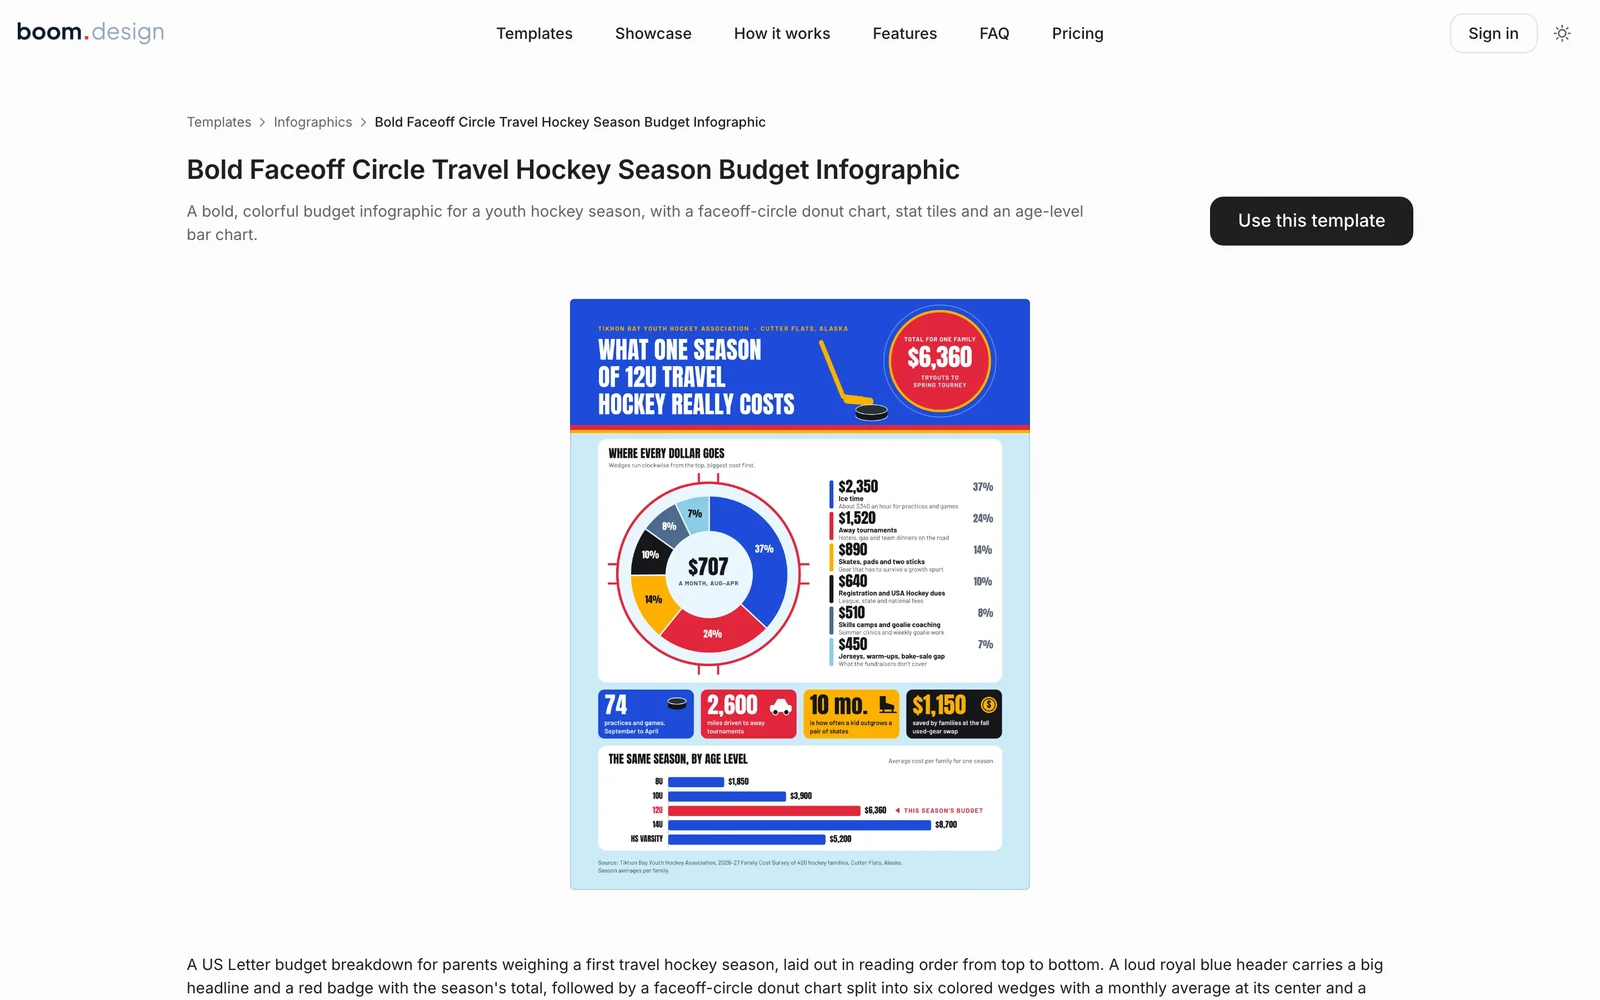
What a season of travel hockey costs one family: a donut chart drawn on a faceoff circle, the monthly cost in its hole, and each wedge listed beside it with its amount and a one-line note ("About $340 an hour"). The wedges run clockwise from the biggest. Four colored tiles and a bar chart by age level follow.

More: budget infographic templates.
Process infographics
13. Numbered stops, one number each
Where a mail ballot goes, from the kitchen table to the certified count, in seven stamped steps down the page. Each step leads with one figure in big type (29 days, 24 hours, 98.7%) and two lines of plain explanation. For a process, the numbers in the circles do the work arrows would.

14. A board game path
A blood donation's journey, from the donor chair to a patient's bedside, laid out as squares on a board game, with a "START" tag and a "Winner!" square at the end. The path snakes back and forth, so six steps fit a square post for social media.

15. Side A and side B
A record-pressing plant's ten steps are laid out as an album's tracklist: side A for the metal, side B for the record, each step with its time on the right where a track's length would be. Splitting a long process into two named halves makes ten steps easy to follow.

Map and travel guide infographics
16. A road, not a map
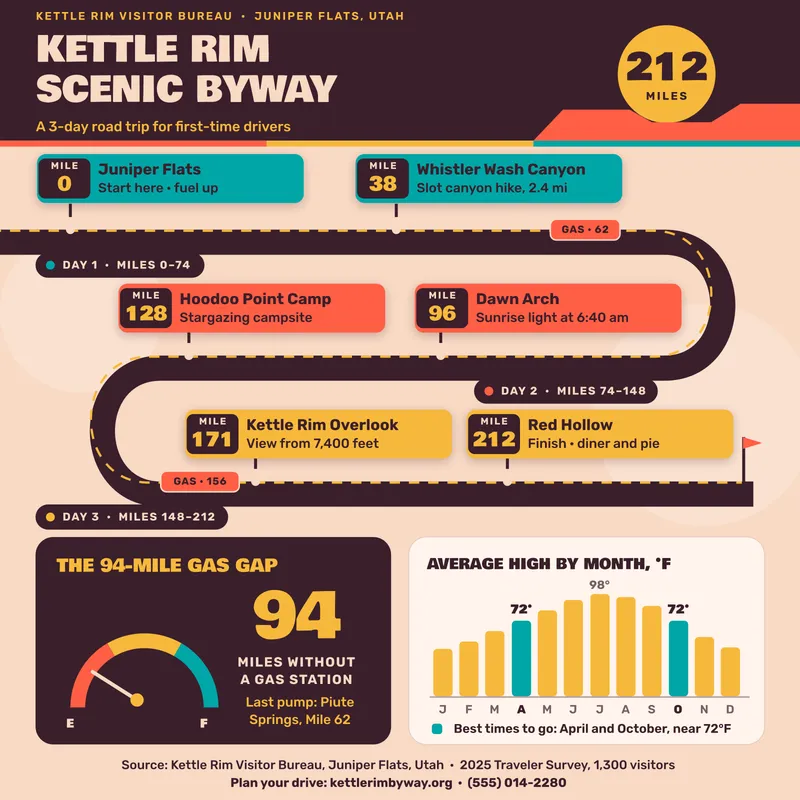
A three-day scenic drive is one winding road with six stops marked by mile, the gas stations on it, and each day's miles. A real map would bury the route in detail; a drawn road shows only what a driver needs. A fuel gauge for the longest stretch without gas and a bar chart of the best months finish it.
17. A transit map for a weekend
A first ice-fishing weekend is drawn as two subway lines: line 1 for getting onto the ice, line 2 for what to do once out there, with a price at every stop. Borrowing a format everyone can already read, a transit map, means nobody needs a legend.

Tips and checklist infographics
18. Six plays, in order
Heat safety for young athletes, written as six plays from a coach's playbook, with a route drawn between them. Each tip ends in a tag with the one figure to remember ("Break every 20 min", "95°F / 104°F"). Tips with numbers are easier to follow than tips without them.
19. A checklist with a countdown
A hurricane checklist sorted by time before landfall (72, 48, 24 and 6 hours), with boxes to tick under each. Ordering tasks by when they're due turns a long list into four short ones. A bar chart at the foot shows how many households had each item ready last season, the go-bag last.

More: checklist infographic templates.
Recipe infographics
20. Ingredients and steps in one grid
A butter mochi recipe laid out as the pan it's baked in, cut into 24 squares: the eight ingredients and six steps fill the first 14, numbered in order. A recipe is a process with a shopping list, and a grid shows both at once. It's square, for a social post.

More: recipe infographic templates.
What the good ones have in common
- One headline that says the point. "What one season of 12U travel hockey really costs" tells the reader what they'll learn. "Hockey statistics" doesn't.
- One reading order. Top to bottom, or along a drawn path. When the eye has to guess where to go next, readers stop.
- The chart that fits the numbers. Bars to compare amounts, a line for change over time, a donut or a grid for parts of a whole, one big number when there's only one.
- Labels on the chart. Put the figure at the end of the bar, not in a legend the eye has to match up.
- Few sizes of type. A headline, a size for the big numbers, and one size for everything else.
- Not color alone. Give every color a label or a figure, so the infographic still reads for someone who can't tell red from green, or in black and white.
- A source line. Say where the numbers come from, in small type at the foot. Every example above has one.
Infographic sizes
| Where it goes | Size in pixels | Shape |
|---|---|---|
| 1000 × 1500 | 2:3, tall | |
| Instagram feed | 1080 × 1350 | 4:5, tall |
| A square post | 1080 × 1080 | 1:1 |
| Printed letter page | 2550 × 3300 at 300 dpi | 8.5 × 11 in |
Pinterest recommends 2:3 and says pins taller than that may be cut off in the feed, so a long infographic is best shown on a page of your own, a blog post for example, with a 2:3 version for Pinterest. For anything you'll print, keep the body text at 8 pt or larger.
How to make an infographic in boom.design
Start from a template
Open any infographic above, or browse the infographic templates, and press Use this template. It opens in the boom.design editor as a project of your own. Starting from a template costs no AI credits.
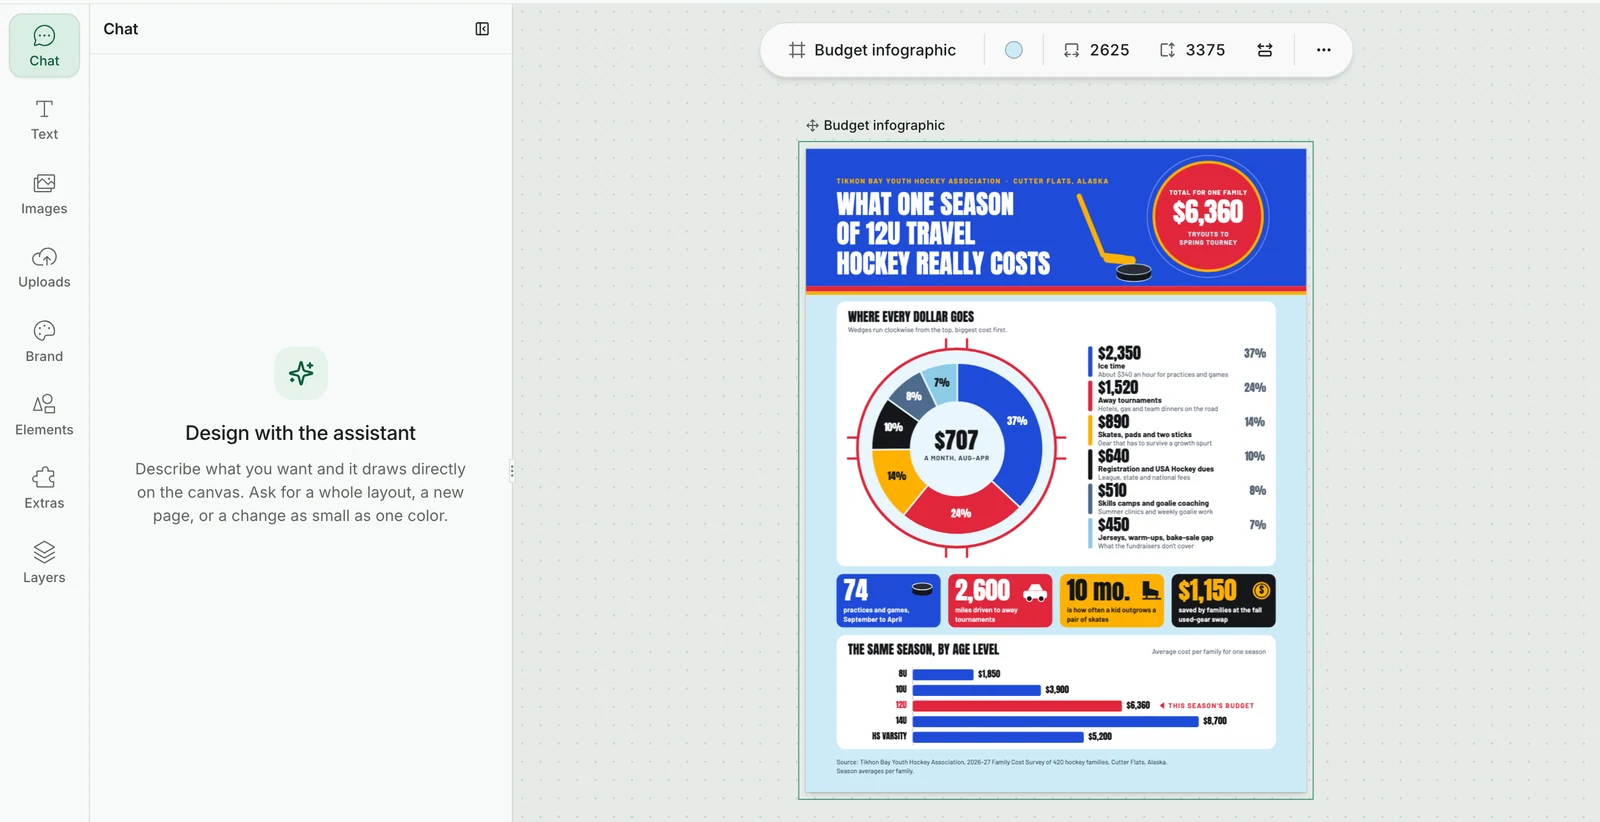
A letter-size infographic opens at 2625 × 3375 pixels: 8.5 × 11 inches at 300 dpi, plus ⅛ inch round every edge for trimming. The page's size shows in the bar above it.
Change the numbers
Every chart in the templates is drawn from shapes and text, not pasted in as a picture, so each bar, wedge and label can be changed. Click a bar of a chart to select it: the toolbar above the page shows its Fill color first, then its border and corners.
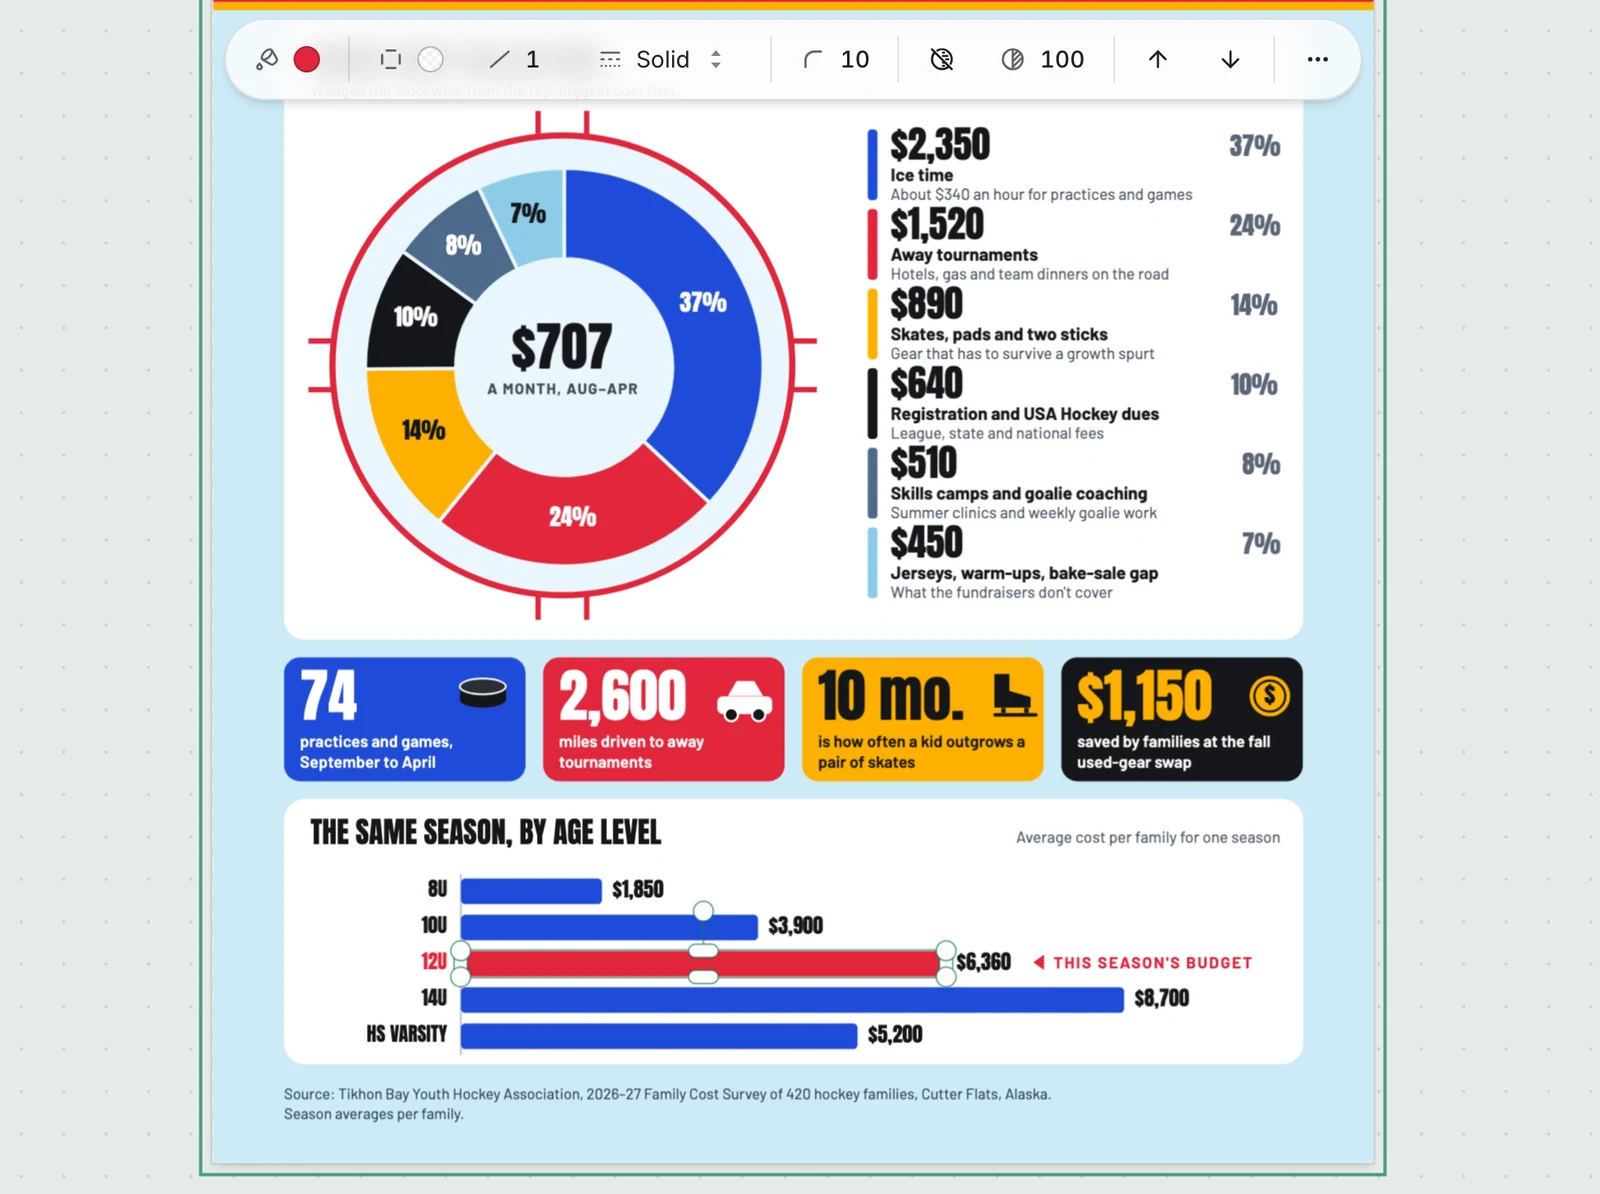
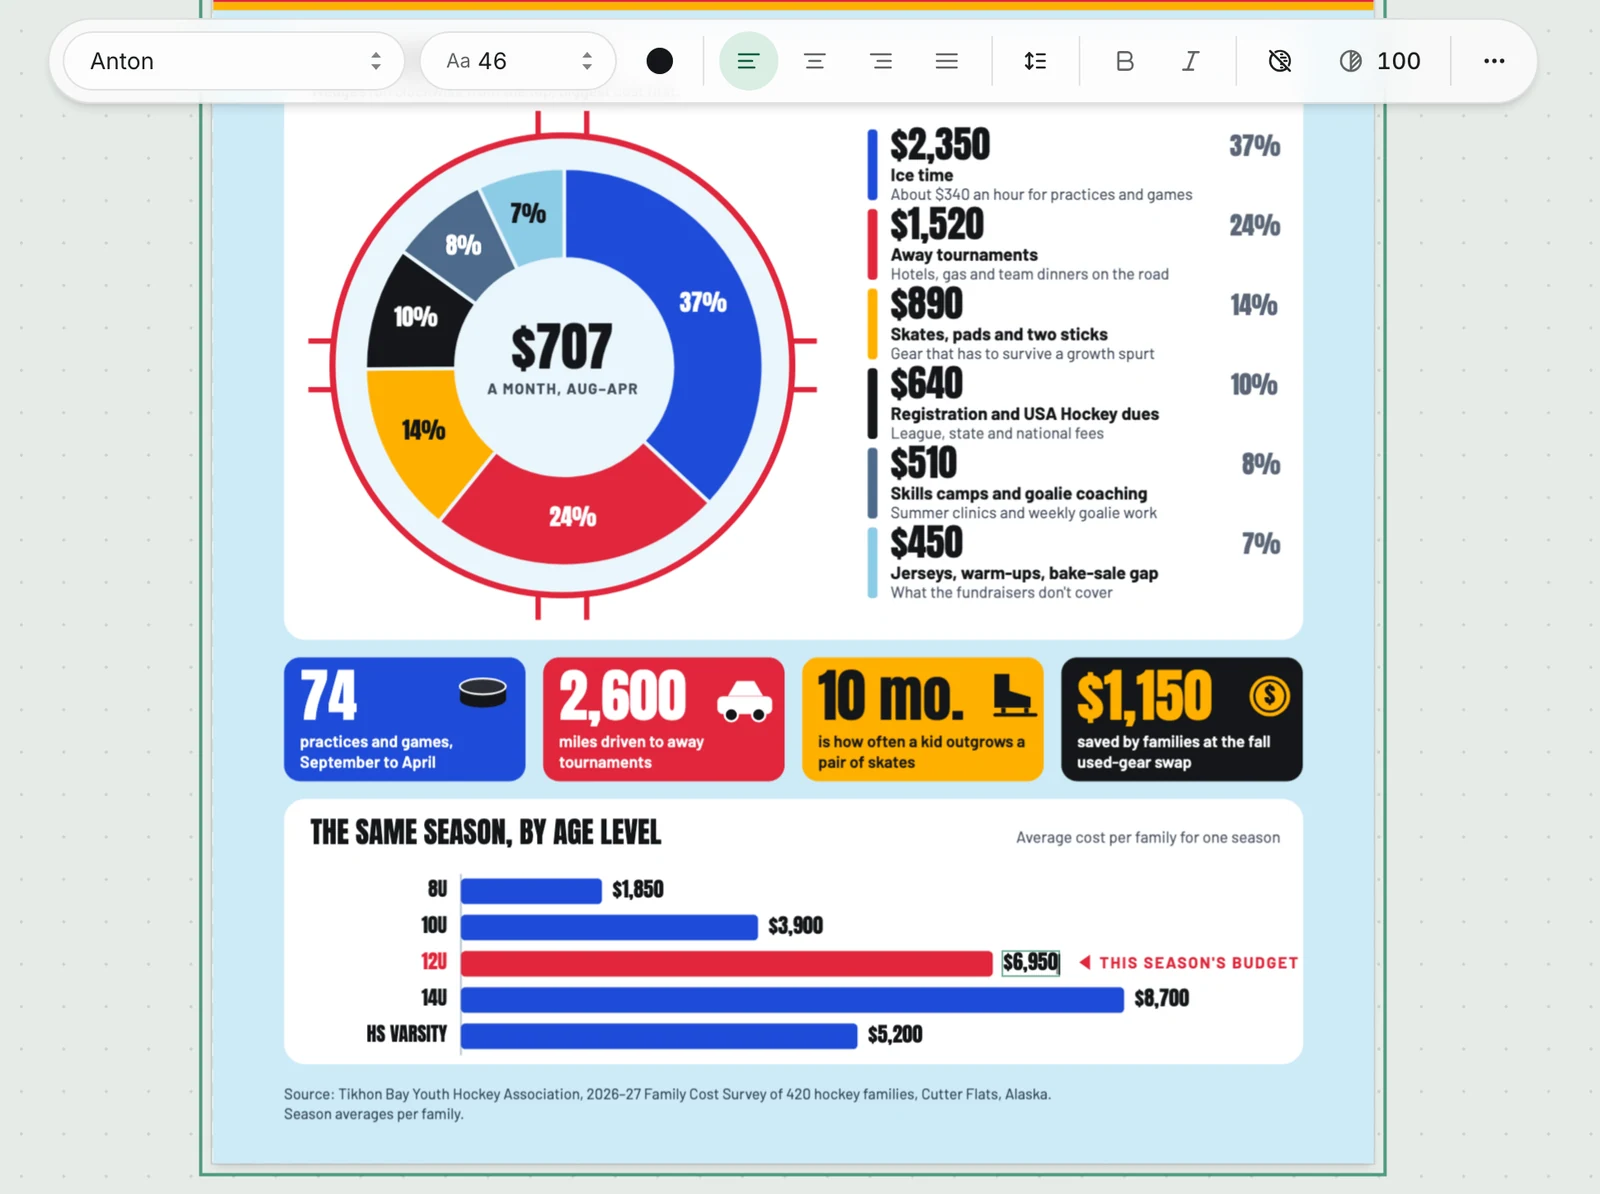
To change a value, drag the handle at the bar's end to its new length, then double-click its label and type the new figure. A bar's length isn't worked out from its label, so check that the bars still match their numbers when you're done. With a text selected, the toolbar holds its font, size, color and alignment.
Or describe your numbers
Type the infographic into the boom.design home page: what it's for, where it will go, and the numbers themselves, pasted in as text. The design agent asks a few questions first, then draws the infographic with its charts built from shapes and text, so you can change them afterwards by hand or by asking. It can also draw pictures for it, such as a mascot or an object to hang the numbers on; each drawing costs 10 AI credits, and a new account comes with 50. To keep to your colors, fonts and logo, choose a brand kit beside the prompt.
Download it
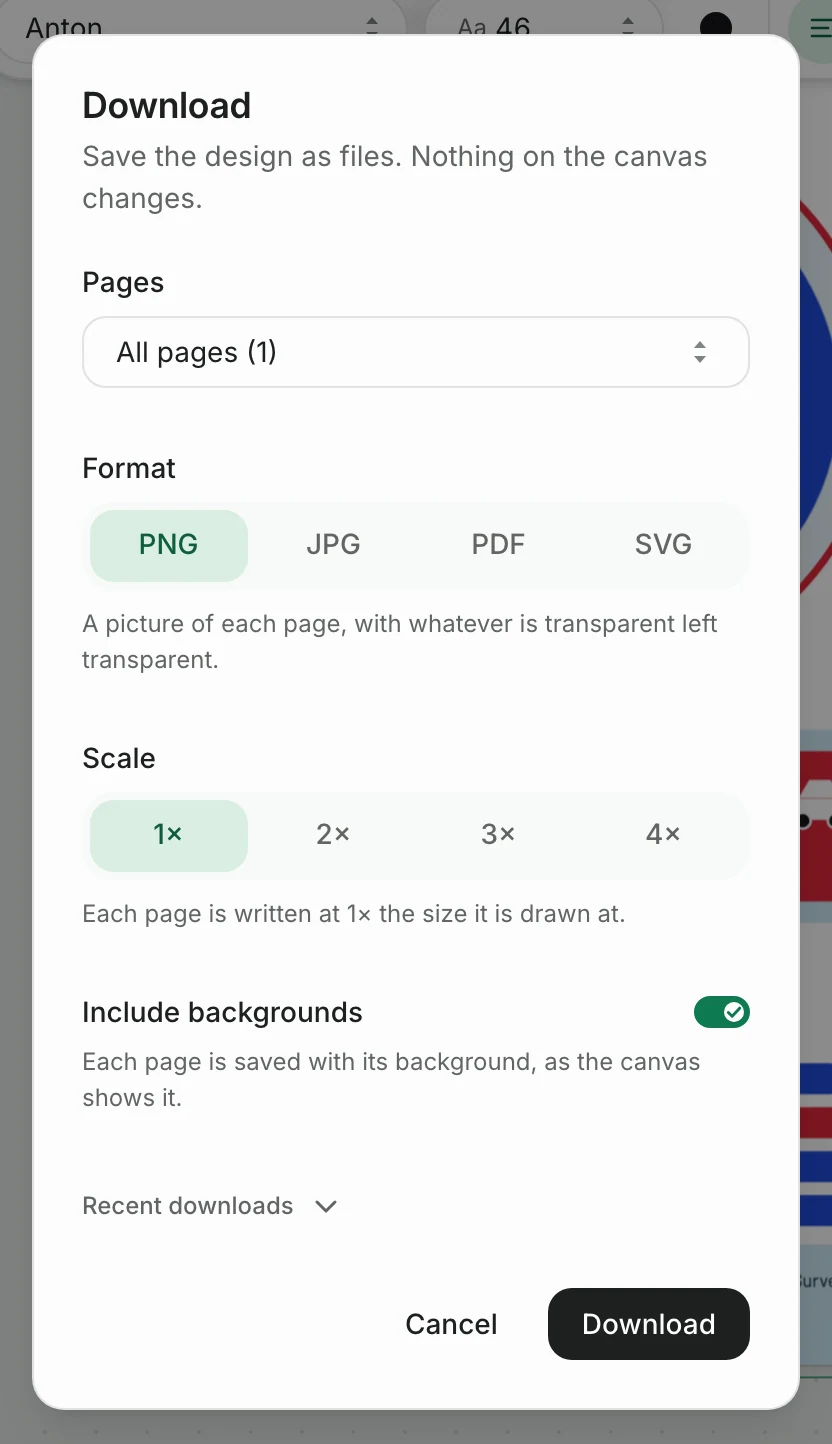
Press Download and choose a format. PNG and JPG come with the free plan, for posting on social media or putting in a newsletter. Paid plans, from Starter up, add PDF, the one to send to a print shop, and SVG.
Infographic questions
What are the nine types of infographics?
The list of nine comes from one design tool's sorting of its templates: statistical, informational, timeline, process, geographic, comparison, hierarchical, list and resume. It isn't a standard, and other lists have three types or thirteen. What matters more is matching the type to your data, as in the table above.
What is the difference between an infographic and a poster?
A poster announces something (an event, a product, a message) and is read in a few seconds. An infographic explains something with data and is read for a minute or more. They overlap: a poster can hold a chart, and a printed infographic is often hung like a poster.
What are some infographic ideas?
A year in numbers for a business, club or school; the results of a survey you ran; a comparison of two things people often ask you to choose between; the steps of a process your customers go through; a budget, for parents or members; a packing list or checklist for a season; a recipe. If people ask you the same question often, the answer is probably an infographic.
More infographics to start from
These are the newest of the boom.design infographic templates. Each one opens in the editor, ready for your own numbers.

Playful Youth Sports Heat Safety Infographic

Illustrated Cincinnati Chili Recipe Instagram Infographic

Bold Baseball Card Binder Fan Survey Infographic

Wood Stove vs. Pellet Stove Comparison Infographic

Pool Lanes Summer Season Statistics Infographic

Dark Striped Canopy Farmers Market Day Timeline Infographic

Dark Diner Pie Case Year in Numbers Infographic

Bold Lake Ice-Out Contest Board Environmental Infographic


