

Dark Salt Dome Winter Road Budget Infographic
A dark, data-heavy square infographic breaking down a city's winter road budget with a salt dome chart, five-winter bar chart and key stats.
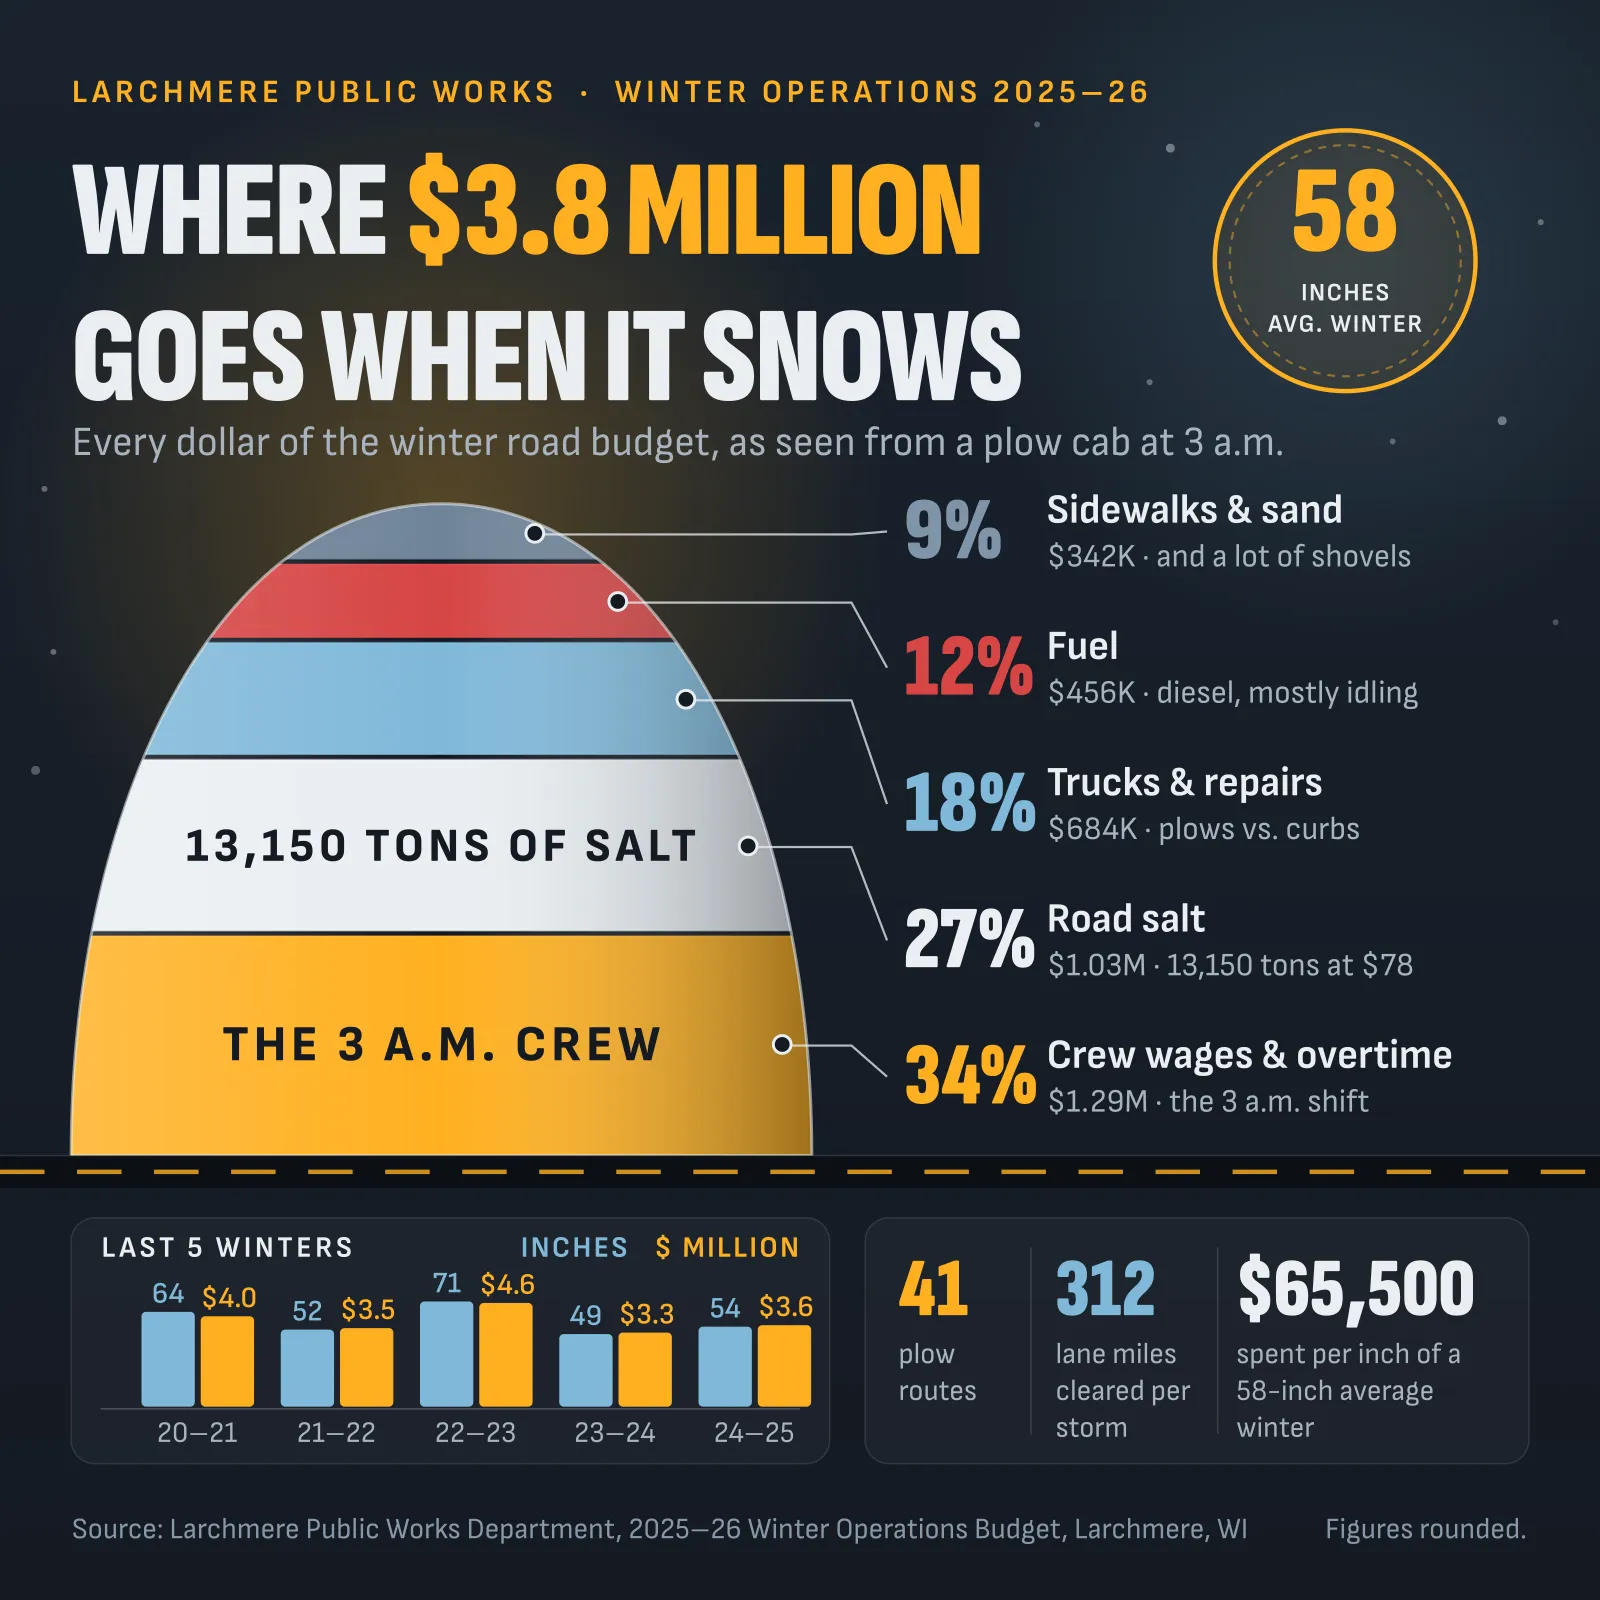
A square infographic for a city public works department to show residents where its winter road budget goes. The main chart is a salt dome drawn in cross-section, its stacked layers sized by share and linked by leader lines to large percentages with a dollar line each. Around it sit a title with a highlighted amount, a round badge for average snowfall, a small bar chart comparing five winters' snowfall with their cost, three headline stat callouts and a source line at the foot. It is dark and data-heavy, with night-asphalt navy, amber, ice blue, white and red, tight condensed type and a dashed road line, and a frank, slightly wry nighttime mood. It could be reused for any local budget or spending breakdown.


